August 29, 2018

What is MAD?

mad

MAD stands for the median absolute deviation.

It is one way to estimate the variability in a set of data, particularly when the data set has some extreme values as outliers. The general approach is to take the absolute values of deviations of individual values from a measure of their central tendency (i.e., the median of the data set).

Why do we choose to use the median instead of the arithmetic mean?

The median, by definition, is the middle value in an ordered sequence of data. Thus, it is unaffected by extreme values in the data set.

Therefore, we calculate the deviation of each data from the median of the original data set and then again find the median of the absolute values of these deviations, expressed as MAD. It is being used in the robust statistics.

We often use wish to use MAD as an estimator of the population standard deviation, but it cannot be adopted directly but has to be multiplied by a constant, 1.4826 first to become a consistent estimate of the population standard deviation.

It may be noted that an important desirable property of a statistic is consistency. A consistent statistic comes nearer to a population parameter when the size of the sample on which it is based gets larger. For example, analysis of 3 samples may give a sample mean which is much different from the expected population mean but when 30 samples are analyzed, the mean would be found much closer to the population parameter as the mean is known to be a consistent statistic.

You may wish to read our previous article robust-statistics-mad-method demonstrates how the constant, 1.4826 is derived from.

August 26, 2018
Estimation of both sampling and measurement uncertainties by Excel ANOVA Data Analysis tool
sample-table

Estimation of sampling and analytical uncertainties using Excel Data Analysis toolpak


In the previous blog ../assets/uploads/2018/08/22/a-worked-example-of-measurement-uncertainty-for-a-non-homogeneous-population/ , we used the basic ANOVA principles to analyze the total chromium Cr data for the estimation of measurement uncertainty covering both sampling and analytical uncertainties….


August 22, 2018
A worked example of measurement uncertainty for a non-homogeneous population
table

A worked example of MU estimation on a non-homogeneous population

For sampling a non-homogeneous target population such as grain cargo, grainy materials or soil, random positions may be selected and split duplicate samples are taken with duplicate laboratory analysis carried out on each sample received. This approach will be able to address both sampling and analytical uncertainties at the same time…..

August 14, 2018
Using Excel’s worksheet functions for 1-factor ANOVA

Data analysis for one factor analysis of variance ANOVA with an equal number of replicates for each ‘treatment’ is probably quicker and easier by using Excel’s traditional functions in the spreadsheet calculations.

One of the advantages is that the manual calculations return live worksheet functions rather than the static values returned by the Data Analysis Toolpak add-ins, so we can easily edit the underlying data and see immediately whether that makes sense or shows a difference to the outcome. On the other hand, we have to run the Data Analysis tool over again if we want to even change one value of the data.

The following figure shows how simple it can be in analyzing a set of test data obtained from sampling at 6 different targets of a population with the laboratory samples analyzed in four replicates. The manual calculations have been verified by the Single Factor Tool in the Data Analysis add-in, as shown in the lower half of the figure.

With the variance results in the form of MS(between) and MS(within), we can proceed easily to estimate the measurement uncertainty as contributed by the sampling and analytical components.

August 13, 2018
Descriptive statistics of Excel Data Analysis Tools

It is convenient for us to use Excel to analyze our data. Indeed, Excel comes equipped with a Descriptive Statistics tool in the Data Analysis add-in package, termed Analysis ToolPak or ATP. With this tool, we get as many as 16 different descriptive statistical parameters without having to enter a single function on the worksheet….

Descriptive statistics of Excel Data Analysis Tools

August 12 2018
Mean or Median?
histogram
Mean or median? You decide

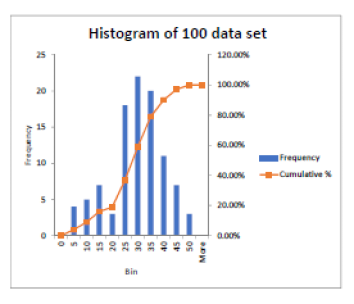
The mean and median are two of the three kinds of “averages”. The third one is called mode. Both mean and median are measures of the central tendency of the dataset, but they have different meanings with different advantages and disadvantages in applications.

The sample mean is calculated as the average of all the data, i.e., we add up all the observations and divide by the number of observations. The median on the other hand partitions the data into two parts such that there is an equal number of observations on either side of the median. So, if we have a set of 5 data arranged in ascending order, the middle value on the 3rd place is the median. However, if we have a set of 6 data in ascending order, then the average of the 3rd and 4th data is the median.

One important advantage of the median is that it is not influenced by extreme values (or outliers statistically speaking) in the dataset. Only either the middle observation or average of the two middle observations is used in the calculation, whilst the actual values of the remaining data are not considered. It is commonly used in proficiency testing programs to assess inter-laboratory comparison data. The robust statistics also uses MAD (median absolute deviation) as a measure of the variability of a univariate quantitative data set.

The mean on the other hand is sensitive to all values in the dataset because every observation in the data affects the mean value, and extreme observations can have a substantial influence on the mean calculated.

Generally speaking, the mean value has some very important mathematical properties that make it possible to prove theorems, such as the Central Limit Theorem. We note that useful results within statistics and inference methods naturally give rise to the mean value as a parameter estimate.

It is much more problematic to prove mathematical results related to the median even though it is more robust to extreme observations. So, the mean is used for systematic quantitative data, unless there is a situation with extreme values, where the median is used, instead.

Therefore, you have to make a professional judgement on which one is to be used to suit your purpose.

August 12 2018
A simple example of sampling uncertainty evaluation
sample

A simple example of sampling uncertainty evaluation

In analytical chemistry, the test sample is usually only part of the system for which information is required. It is not possible to analyze numerous samples drawn from a population. Hence, one has to ensure a small number of samples taken are representative and assume that the results of the analysis can be taken as the answer for the whole…..