Why do we perform hypothesis tests?
A course participant commented the other day that descriptive statistical subjects were much easier to understand and could be appreciated, but not the analytical or inferential statistics which call for logical reasoning and inferential implications of the data collected.
I think the core issue lies on the abstract nature of inferential statistics. Hypothesis testing is a good example. In here, we need to determine the probability of finding the data given the truth of a stated hypothesis.
A hypothesis is a statement made that might, or might not, be true.
Usually the hypothesis is set up in such a way that it is possible for us to calculate the probability (P) of the data (or the test statistic calculated from the data) given the hypothesis, and then to make a decision about whether the hypothesis is to be accepted (high P) or rejected (low P).
A particular case of a hypothesis test is one that determines whether or not the difference between two values is significant – a significance test
For this case, we actually put forward the hypothesis that there is no real difference and the observed difference arises from random effects. We assign this as the null hypothesis (Ho).
If the probability that the data are consistent with the null hypothesis (HO) falls below a predetermined low value (say, 0.05 or 0.01), then the HO hypothesis is rejected at that probability.
Therefore, p< 005 means that if the null hypothesis were true, we would find the observed data (or more accurately, the value of the test statistic, or greater, calculated from the data) in less than 5% of repeated experiments.
To use this in significance testing, a decision about the value of the probability below which the null hypothesis is rejected, and a significance difference concluded, must be made.
In laboratory analysis, we tend to reject the null hypothesis “at the 95% level of confidence” if the probabiity of the test statistic, given the truth of HO falls below 0.05. In other words, if HO is indeed correct, less than 5% (i.e. 1 in 20 numbers) averages of repeated experiments would fall outside the limits. In this case, it is concluded that there was a significant difference.
However, it must be stressed that the figure of 95% is a somewhat arbitrary one, arising because of the fact that (mean +2 standard deviation) covers about 95% of a population.
With modern computers and spreadsheets, it is possible to calculate the probability of the statistic given a hypothesis, leaving the analyst to decide whether to accept or reject it.
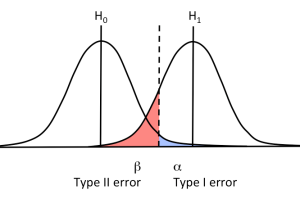
In deciding what a reasonable level to accept or reject a hypothesis is, i.e. how significant is “significant”, two scenarios, in which the wrong conclusion is arrived at, need to be considered. Therefore, there is a “risk” in making a wrong decision at a specified probability.
A so-called Type I error is in the case where we reject a hypothesis when it is actually true. It may also be known as “a false positive ”.
The second scenario is the opposite of this, when the significance test leads to the analyst wrongly accepting the null hypothesis although in reality HO is false (a Type II error or a false negative).
We had discuss these two types of error in the short articles: ../assets/uploads/2017/12/28/type-i-and-type-ii-errors-in-significance-tests/ ,and ../assets/uploads/2017/03/01/sharing-a-story-of-type-i-error/
