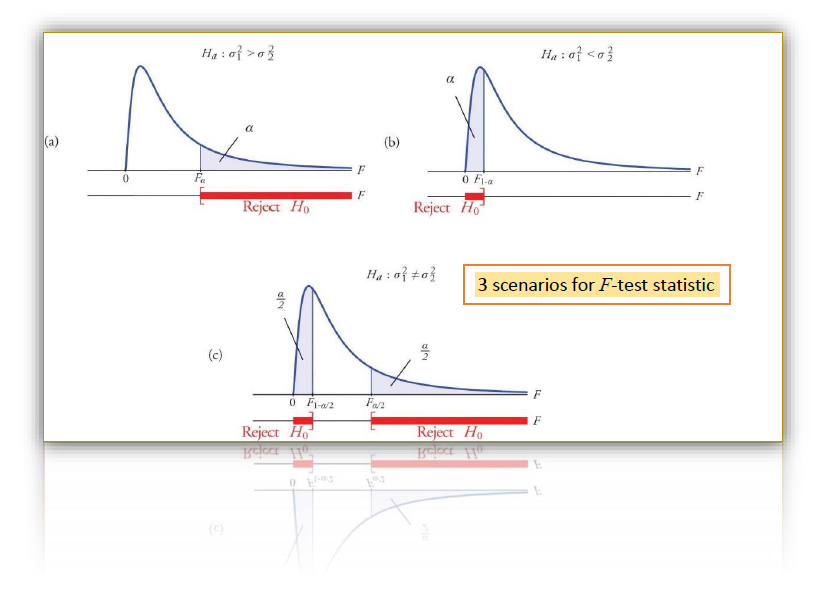


The Fisher F-test statistic is based on the ratio of two experimentally observed variance, which are squared standard deviations. Therefore, it is useful to test whether two standard deviations s1 and s2, calculated from two independent data sets are significantly different in terms of precision from each other. Read more …The variance ratio F-test statistic

A simple example of sampling uncertainty evaluation
In analytical chemistry, the test sample is usually only part of the system for which information is required. It is not possible to analyze numerous samples drawn from a population. Hence, one has to ensure a small number of samples taken are representative and assume that the results of the analysis can be taken as the answer for the whole…..
Whilst attending an Eurachem Scientific Workshop on June 14-15, 2018 at Dublin of Ireland, the workshop organizer arranged the Workshop Banquet at the renowned Guinness St. James Gat Brewery, whose one of the employees was William Sealy Gosset, a chemist cum statistician.
Gosset was interested in analyzing quality data obtained small sample size in his routine work on quality control of raw materials, as he noticed that it was neither practical nor economical in analyzing hundreds of data.
At that time, making statistical inferences from small sample-sized data to their population was unthinkable. The general accepted idea was that if you were to have a large sample size, say well over 30 observations, you could use the Gaussian’s normal distribution to describe your data.
In 1906, Gosset was sent to Karl Pearson’s laboratory at the University College London on sabbatical. Pearson then was one of the well known scientific figures of his time, who was later credited with establishing the field of statistics.
At the laboratory, Gosset discovered the “Student’s t-distribution”, which is an important pillar of modern statistics to use small sample-sized data to infer what we could expect from the population out there. It is the origin of the concept of “statistical significance testing”.
Why didn’t Gosset name the distribution as Gosset’s instead of Student’s?
It is interesting to note that it was because his employer, Guinness objected to his proposal to publish the findings as it did not want the competitors to know their gained advantage in using this unique procedure to select the best varieties of barley and hops for their popular beer in a way that no other business could do.
So finally Gosset published his article on Pearson’s journal Biometrika in 1908 under the pseudonym “Student”, leading to the famous “Student’s t-distribution”.
In statistics and probability studies, the t-distribution is a probability distribution in dealing with a normally distributed population whilst the sample size is not large. It uses sample standard deviation (s) to estimate the population standard deviation (s) which is unknown. For small samples, the confidence limits of the population mean are given by:

As the story goes, Gosset’s published paper was then mostly ignored by the statistical researchers until a young mathematician called R.A, Fisher discovered its importance and popularized it, particularly in estimating the random chance for considering a result “significant”.
Today, the t-distribution is routinely used as t- statistic tests for checking results for significance bias from true value, or for comparing measurements two sets of results and their means, and is also important for calculating confidence intervals.
This t-distribution is symmetric and resembles the normal distribution except for rather stronger “tails” due to more spread out because of the extra variability in smaller sample size.

A Worked Example
Suppose that we determined the amount of uranium contents in 14 stream water samples by a well-established laboratory method and a newly-developed hand-held rapid field method…..
A linear regression approach to bias between methods – Part II
Category:
BASIC STATISTICS MEASUREMENT UNCERTAINTY
TAGGED WITH
BIAS LINEAR REGRESSION SIGNIFICANCE UNCERTAINTY Significance testing
To understand how to go about evaluating sampling uncertainty and quality control of sampling, we must be familiar with the basic analysis of variance ANOVA principles….