
A few words on sampling
Sampling is a process of selecting a portion of material (statistically termed as ‘population’) to represent or provide information about a larger body or material. It is essential for the whole testing and calibration processes.
The old ISO/IEC 17025:2005 standard defines sampling as “a defined procedure whereby a part of a substance, material or product is taken to provide for testing or calibration of a representative sample of the whole. Sampling may also be required by the appropriate specification for which the substance, material or product is to be tested or calibrated. In certain cases (e.g. forensic analysis), the sample may not be representative but is determined by availability.”
In other words, sampling, in general, should be carried out in random manner but so-called judgement sampling is also allowed in specific cases. This judgement sampling approach involves using knowledge about the material to be sampled and about the reason for sampling, to select specific samples for testing. For example, an insurance loss adjuster acting on behalf of a cargo insurance company to inspect a shipment of damaged cargo during transit will apply a judgement sampling procedure by selecting the worst damaged samples from the lot in order to determine the cause of damage.
Field sample Random sample(s) taken from the material in the field. Several random samples can be drawn and compositing the samples is done in the field before sending it to the laboratory for analysis
Laboratory sample Sample(s) as prepared for sending to the laboratory, intended for inspection or testing.
Test sample A sub-sample, which is a selected portion of the laboratory sample, taken for laboratory analysis.
Randomization
Generally speaking, random sampling is a method of selection whereby each possible member of a population has an equal chance of being selected so that unintended bias can be minimized. It provides an unbiased estimate of the population parameters on interest (e.g. mean), normally in terms of analyte concentration.
Representative samples
“Representative” refers to something like “sufficiently like the population to allow inferences about the population”. By taking a single sample through any random process may not be necessary to have representative composition of the bulk. It is entirely possible that the composition of a particular sample randomly selected may be completely unlike the bulk composition, unless the population is very homogeneous in its composition distribution (such as drinking water).
Remember the saying that the test result is no better than the sample that it is based upon. Sample taken for analysis should be as representative of the sampling target as possible. Therefore, we must take the sampling variance into serious consideration. The larger the sampling variance, the more likely it is that the individual samples will be very different from the bulk.
Hence, in practice, we must carry out representative sampling which involves obtaining samples which are not only unbiased, but which also have sufficiently small variance for the task in hand. In other words, we need to decide on the number of random samples to be collected in the field to provide smaller sampling variance in addition to choosing randomization procedures that provide unbiased results. This is normally decided upon information such as the specification limits and uncertainty expected.
Composite samples
Often it is useful to combine a collection of field samples into a single homogenized laboratory sample for analysis. The measured value for the composite laboratory sample is then taken as an estimate of the mean value for the bulk material.
It is important to note also that the importance of a sound sub-sampling process in the laboratory cannot be over emphasized. Hence, there must be a SOP prepared to guide the laboratory analyst to draw the test sample for measurement from the sample that arrives at the laboratory.
Today, sampling uncertainty is recognized as an important contributor to the measurement uncertainty associated with the reported results.

It is to be noted that sampling uncertainty cannot be estimated as a standalone identity. The analytical uncertainty has to be evaluated at the same time. For a fairly homogeneous population, a one-factor ANOVA (Analysis of Variance) method will be suffice to estimate the overall measurement uncertainty based on the between- and within-sample variance. See https://consultglp.com/2018/02/19/a-worked-example-to-estimate-sampling-precision-measuremen-uncertainty/
However, for heterogeneous population such as soil in a contaminated land, sample location variance in addition to sampling variance to be taken into account. More complicated calculations involve the application of the two-way ANOVA technique. An EURACHEM’s worked example can be found at the website: https://consultglp.com/2017/10/10/verifying-eurachems-example-a1-on-sampling-uncertainty/

A worked example of MU estimation on a non-homogeneous population
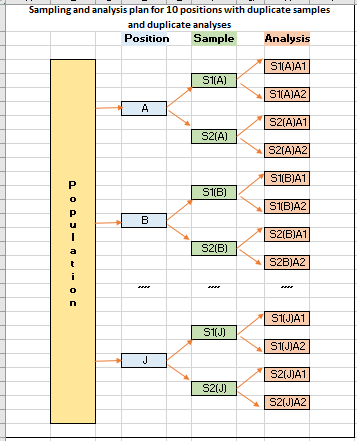
For sampling a non-homogeneous target population such as grain cargo, grainy materials or soil, random positions may be selected and split duplicate samples are taken with duplicate laboratory analysis carried out on each sample received. This approach will be able to address both sampling and analytical uncertainties at the same time…..
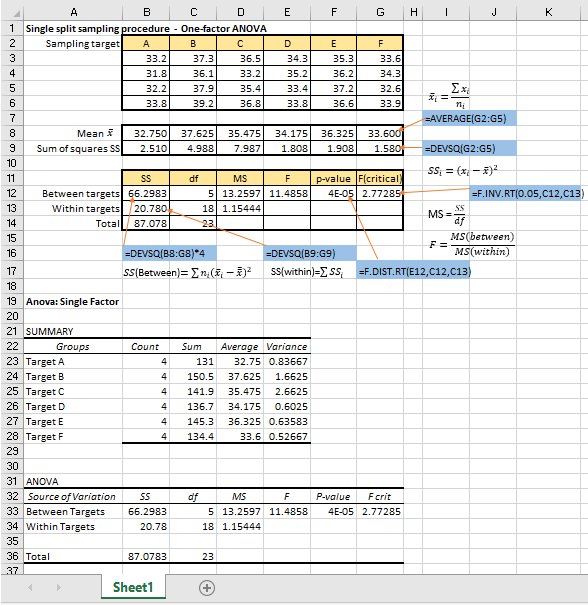
Data analysis for one factor analysis of variance ANOVA with an equal number of replicates for each ‘treatment’ is probably quicker and easier by using Excel’s traditional functions in the spreadsheet calculations.
One of the advantages is that the manual calculations return live worksheet functions rather than the static values returned by the Data Analysis Toolpak add-ins, so we can easily edit the underlying data and see immediately whether that makes sense or shows a difference to the outcome. On the other hand, we have to run the Data Analysis tool over again if we want to even change one value of the data.
The following figure shows how simple it can be in analyzing a set of test data obtained from sampling at 6 different targets of a population with the laboratory samples analyzed in four replicates. The manual calculations have been verified by the Single Factor Tool in the Data Analysis add-in, as shown in the lower half of the figure.
With the variance results in the form of MS(between) and MS(within), we can proceed easily to estimate the measurement uncertainty as contributed by the sampling and analytical components.


A simple example of sampling uncertainty evaluation
In analytical chemistry, the test sample is usually only part of the system for which information is required. It is not possible to analyze numerous samples drawn from a population. Hence, one has to ensure a small number of samples taken are representative and assume that the results of the analysis can be taken as the answer for the whole…..
Since the publication of the newly revised ISO/IEC 17025:2017, measurement uncertainty evaluation has expanded its coverage to include sampling uncertainty as well because ISO has recognized that sampling uncertainty can be a serious factor in the final test result obtained from a given sample ……
The concept of measurement uncertainty – a new pespective


A Worked Example
Suppose that we determined the amount of uranium contents in 14 stream water samples by a well-established laboratory method and a newly-developed hand-held rapid field method…..
A linear regression approach to bias between methods – Part II
Category:
BASIC STATISTICS MEASUREMENT UNCERTAINITY
TAGGED WITH
BIAS Linear Regression SAMPLING UNCERTAINITY Significance testing

Measurement uncertainty has two main contributors, namely sampling uncertainty and analytical uncertainty, but most laboratory analysts tend to equate analytical uncertainty as its measurement uncertainty based on the sample received. This may be true when the target (population) lot sampled is homogeneous where every part of the target have an equal chance of being incorporated in the sample…..

Nearly all analysis requires the taking of a sample, a procedure which itself introduces uncertainty into the final test result. Hence a measurement uncertainty should cover both the uncertainties of sampling and analysis….