

Yes, measurement error and measurement uncertainty are two different concepts but many laboratory personnel somehow cannot really differentiate them. It is utmost important for them to see their differences.
We know all measurements are affected by uncontrollable factors. No two replicated measurements give exactly the same result, except physical counting of objects.
By definition. error is the difference between an individual test result and the true value of the measurand (targeted analyte) in a given sample, whilst a true value refers to the actual amount of the measurand present in the sample. In fact, all true values by nature are indeterminate, meaning that they can only be determined under perfect analysis conditions which are not achievable in practice.
If we were to use a certified reference material for our laboratory analysis, then an observed measurement error would then be the difference between the observed value and its reference or certified value which by itself carries an uncertainty as well. These values are not 100% true values!
When we find a measurement error is systematic, i.e. the measurement results differ significantly from the reference or certified value, we say the mean measurement result has a bias and such systematic error may be corrected with a correction factor, if deemed necessary. Even after the correction, the reported value still has a certain amount of error.
Measurement uncertainty, on the other hand, is expressed in the form of a range or interval after evaluating all contributions of uncertainty factors, and, if estimated for an analytical method and defined sample type, may apply to all determinations so described.
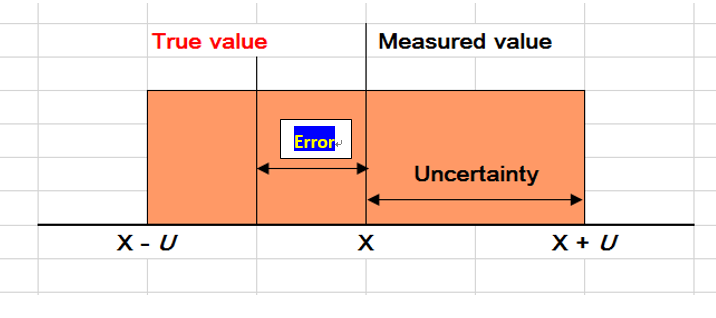
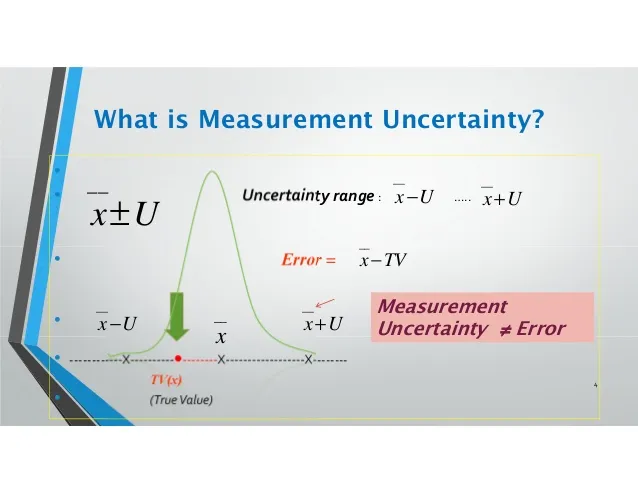
The measurement uncertainty therefore tells us what size the measurement error might be, and the range would have covered the true value at a certain level of confidence, such as 95%. In general, the value of the uncertainty cannot be used to correct a measurement result.
It is important to stress that the uncertainty of the result of a measurement should never be interpreted as representing the error itself, nor the error remaining after correction.
The following sketch gives a clear picture of the differences between measurement error and measurement uncertainty.
A2LA (The American Association for Laboratory Accreditation) in its policy document P103b – Annex: Policy on estimating measurement uncertainty for life sciences testing labs reckons that when a test laboratory uses chemical, environmental or biological test methods traceable to published regulatory or consensus methods (such as FDA, EPA, AOAC, ASTM, ISO, BS, EN, etc), measurement uncertainty (MU) shall be estimated using available data, published information, and/or some designed experiments. That means uncertainty can be estimated using laboratory control samples (LCS), method validation studies, or by appropriate model for the propagation of error components.
ASTM E 2554-13:
The A2LA G108 states that:
 where sa, sb, … are the standard deviations of the other uncertainty components
This method involving the use of LCS with same target values is the simplest amongst the three methods discussed so far. The other two methods that we had discussed are using the intermediate reproducibility duplicates, and the recovery replicates. It can be shown that this method, however, tends to produce a much bigger uncertainty as only single analysis data point is taken in the evaluation as compared to the other approaches using duplicates results or matrix spiked recoveries which provide better confidence in the outcome.
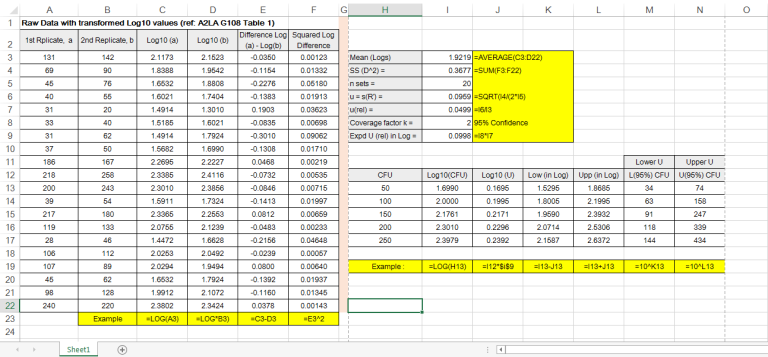
Image 1 below shows the A2LA example on 20 LCS replicates analyzed over a period of time under the laboratory intermediate reproducibility conditions:
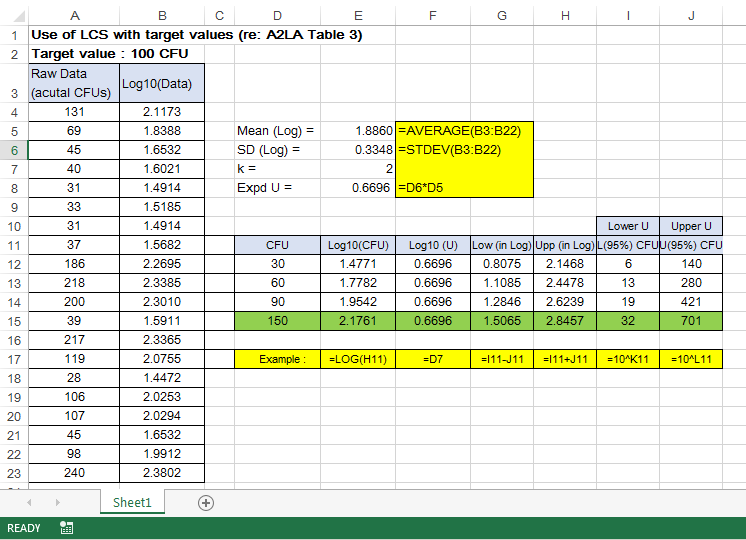
This example has also covered most sources of uncertainty in the analytical process. It is recommended that 20 or more individual LCS data points are to be obtained to estimate the pooled standard uncertainty in terms of pooled standard deviation, sp. The evaluation of the combined uncertainty is then expanded by multiplying sp with a coverage factor k =2 for 95% confidence.
In concluding this series of MU estimation on microbial count testing, we should say that the three procedures described in this article and the other two earlier ones are having their own merits and disadvantages, and no one process is favored over the other. It is up to the laboratory concerned to exercise its professional judgment in deciding whether the MU estimate obtained from any of these approaches is reasonable and whether it meets the needs of its customers.
Category:
Basic statistics , Measurement uncertainty , Top-Down Approach
TEGGED WITH:
Tagged with:MicrobiologyIn the last article, we showed how intermediate reproducibility duplicates data of the laboratory control samples (LCS’s) could be used to estimate the measurement uncertainty of an aerobic count method. If it is safe to assume that analysis recovery is reasonably constant for a particular organism in a given sample matrix, the uncertainty in a microbial enumeration test can be evaluated by studying the recovery data over time.
But, what is analysis recovery?
Recovery > is defined as “Proportion of the amount of analyte, present in or added to the analytical portion of the test material, which is extracted and presented for measurement”. In a method validation protocol, analytical recovery studies are an essential component which cannot be ignored.
overy data R obtained as the ratio of the concentration of analyte found to that stated to be present, can be used to determine bias present in a particular test method by studying if the difference between the actual test result is found to be significantly different from the assigned or known value. Even if the bias does exist, it is still not current conventional practice to correct for bias in quantitative microbiology results.
Therefore to get a recovery data, one has to add a known amount of analyte to a matrix and the whole matrix is then subject to the whole process of the test method. The amount recovered minus the original amount present should indicate the recovery factor.
In a perfect situation, R would be exactly unity (1) but in reality, circumstances such as imperfect extraction or serial dilutions often give observations that differ from the ideal.
Hence, we must take note of the sources of uncertainty in recovery estimation. Some of them are:
Consequently, recovery differences over time reflect the various uncertainty contributors, including but not limiting to the following:
The aim of this method therefore is to use recovery variations of laboratory control samples over time to determine how various sources of uncertainty affect the final test results.
A2LA calculation method
A recovery test is conducted by plating the same amount of inoculum in petri dishes with and without the matrix of interest and counting the colony forming units (CFU’s) after growth in sterile nutrient agar at specified temperature over incubation time required. The difference between the counts from the plate without matrix and the plate with matrix samples is a measure of recovery of the organism, usually expressed as a percentage of the CFU count in the inoculated sample.
A2LA carried out 20 replicates of great different inoculated levels and found the recovery was reasonably constant. Hence, it is assumed that the matrix used for this study is representative of those samples where an estimate of uncertainty is needed.
Image 1 below shows the data of the recovery replicates obtained over time and the subsequent calculation involving transformation of data to logarithmic values.
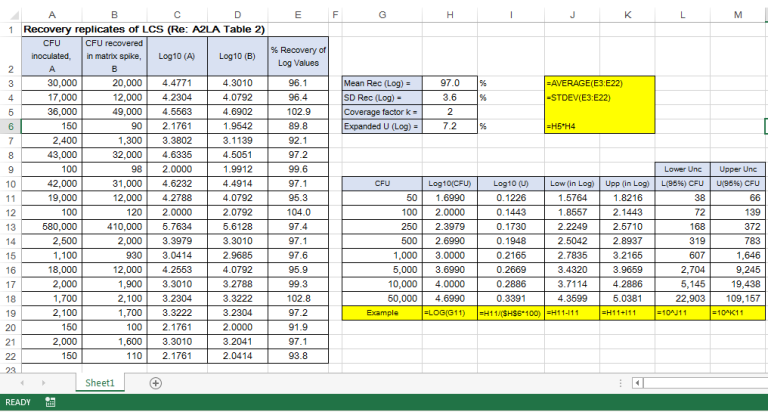
For example, for a result of 1,000 CFU, we can report the uncertainty interval as 606 to 1,647 CFU.
It may be noted that the actual calculated interval was 607 and 1,646, but for maximum coverage of 95% confidence interval, the results by convention are always “rounded down” for the value at the lower end of the range and always “rounded up” for the value at the upper end.
Like the method using the intermediate reproducibility data, this current method has also adequately captured in the estimate various types of uncertainty sources, namely: random error, counting error, dilutions, environment, equipment and analyst.
method for estimating uncertainty for microbiological plate count

The conventional aerobic plate counting method for examining the level of microorganism in a food product has often been referred to AOAC Official Methods of Analysis and APHA Standard Methods for the Examination of Dairy Products. Basically it uses physical counting for determining the number of colonies in a test sample.
Generally speaking, in order to interpret the results properly after using any physical, chemical or biological procedure, we must carefully consider the diverse sources of actual or potential error associated with the results obtained. Generally, any test result is influenced by a complex of three major errors, namely:
Particularly in microbiological testing, when a method has a known consistent bias which is inherent to the method, through studies of low recoveries of targeted microorganisms, such a bias shall not be corrected with a factor after adjusting for recovery on a sample that is spiked with a known amount of the analyte. This is due to the empirical nature of microbial enumerations. Instead, the number of colony-forming units (CFUs) per unit of sample is to be reported with a bias clearly noted for reference. One cannot in practice determine a true value in microbiological count testing. Even when using certified reference materials or values derived from inter-laboratory studies, only part of the total bias can be assessed.
A measure of random errors of a test method can be handled by any statistical parameters associated with the test result, namely repeatability and intermediate precision in terms of standard deviation and variance. Because of the existence of such uncontrollable errors, the analytical data must be expressed with an interval (i.e. X + U) under a certain degree of confidence, such as 95%.
As we know, all accredited testing laboratories are required to apply procedures for estimating uncertainty of measurement (ISO/IEC 17025:2005).
The ISO/TS 19036:2006 “Microbiology of food and animal feeding stuffs – Guidelines for the estimation of measurement uncertainty for quantitative determinations” reckons that the usual ISO GUM bottom up or component-by-component approach with consideration of uncertainty components of each step of the test method underestimates the uncertainty because the factors which influence the uncertainty of microbiological enumerations are still not well understood and one may miss some significant uncertainty contributions by the process.
The Eurachem document “Accreditation of Microbiological Laboratories” (2nd edition, 2013) also states that: “Microbiological tests generally come into the category of those that preclude the rigorous metrologically and statistically valid calculation of measurement uncertainty as described in the ISO GUM. It is generally appropriate to base the estimate of measurement uncertainty on repeatability and intermediate precision (within laboratory reproducibility) data.”
A guidance document G108 prepared by the American Association for Laboratory Accreditation (A2LA), titled “Guidelines for Estimating Uncertainty for Microbiological Counting Methods” is a good source of reference for estimating uncertainty in microbiological analysis. It suggests four top down approaches to estimate measurement uncertainty, namely:
Coming blog articles will discuss each of these ways in simpler language and it is hoped that our microbiologists and laboratory colleagues will find them easy to apply these concepts in evaluating uncertainty.

Petri dish A The conventional standard agar plate count methods such as those stated in BAM, AOAC, APHA, ISO, etc. used for monitoring microbial activities in foodstuffs involve the counting of the number of colony forming units (CFU’s) of a prepared sample homogenate in duplicate after cultivation of microorganisms over a stipulated incubation period with dilutions in a selective agar medium for enumeration.
It is nearly impossible to know the true amount of viable microorganisms in a sample, just like those chemical analytical methods do. Quantitative culture-based microbiological methods also have performance attributes and operational limits in standard method validation exercises. But, unlike chemical analytical methods, many of the performance attributes of culture methods are based upon particle distribution (i.e., distribution of the microorganisms) as defined by the Poisson distribution.
There is also a possible over-dispersion in a culture method due to clumping of microbes or insufficient dilution made at the sample preparation stage. Other technical factors such as physic-chemical properties and overall microbial composition of the sample, incubation stress leading to damaging organisms, detection media components and incubation conditions can also contribute to variability and uncertainty in measurements by these methods.
Uncertainty of measurement can also arise within and between experiments from many sources including inconsistencies in quality of reagents, pipette calibration, as well as dilution preparation and storage conditions of standards. However, in theory most, if not all, of them are controllable, such as checking of performance of culture media, incubators, weighing balance, pipettors and other instruments, and between-analyst repeatability within laboratory.
Hence, we may summarize the following uncertainty contributors to an aerobic count experiment, many of which are not easily quantifiable:
Category:
Basic statistics , Measurement uncertainty , Top-Down Approach
TEGGED WITH:
Aerobic plate count ,Microbiology