Using an ordinary spreadsheet to calculating a combined uncertainty saves a great deal of time and is particularly useful for checking and updating with new data whenever available.
The Eurachem/CITAC Guide (3rd edition) Quantifying Uncertainty in Analytical Measurement has given a number of spreadsheet calculation examples. The approach using the MS Excel spreadsheet is summarized as described below.
Assume that the test result y is a function of three input parameters p, q and r, i.e. y = f (p, q, r), such as: y=(p x q)/r.
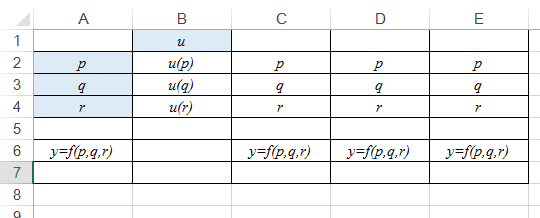
Let’s set up a basic spreadsheet as in Figure 1:
In Figure 1, enter the values of p, q, r and the formula for calculating y in cell A6 of the spreadsheet and the respective values of standard uncertainties u(p), u(q) and u(r) in column B. Copy cell A6 across to C6:E6.
Figure 1: Entries of raw data

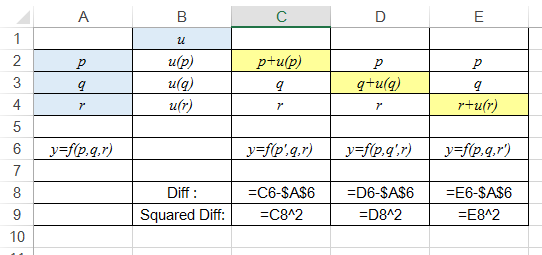
Add u(p) to p in cell C2, u(q) to q in cell D3, and u(r) to r in cell E4 as in Figure 2 below. Upon recalculating the spreadsheet automatically by the software, cell C6 then becomes f(p+u(p),q, r) [denoted by f(p’,q,r)], and so are the others.
Figure 2: Entries of individual standard uncertainty contributions

The row 8 of Figure 2 calculates the difference between the calculated y values in columns C, D and E individually and the originally calculated y value in A6. The row 9 shows the squared differences of columns C, D and E.
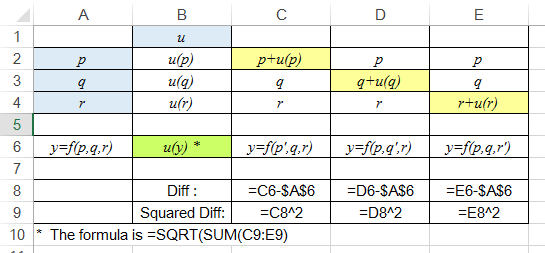
To obtain the combined standard uncertainty in y, i.e. u(y), just sum up all these individual squared differences in row 9 and take a square root of the sum, as shown in Figure 3.
Figure 3: Calculation of combined standard uncertainty

In fact, the contents of the cells C8, D8 and E8 show the contributions ui(y)=ciu(xi) of the individual uncertainty components to the uncertainty in y, making it easy to see which components are significant. It may be noted that ci is called the sensitivity coefficients of standard uncertainty u(xi).
A screen picture captured from the Eurachem/CITAC Guide on an example of the calculation table is shown below.

