The purpose of writing this blog is not to promote how to lie or cheat with statistics but to help you spot other people lying or, politely speaking, to spot their “statistical abuse”.

In fact, you cannot work in statistics for too long before someone comes along and demonstrate to you how you can play unethical tricks with statistics. We have seen many people often misuse statistics when attempting to persuade someone to their point of view, although their original or raw data collected might be truthful and reliable.
The famous quote: “There are three kinds of lies: lies, damned lies, and statistics.” first attributed to the 19th century British Prime Minister Benjamin Disraeli but the source for this view was popularized in the autobiography of Mark Twain, where he made that attribution. Twain used this phrase to talk about the persuasive power numbers have and how they can be manipulated by individuals to push a public agenda.
There is even a small but very popular book called How to Lie with Statistics by former editor at Look magazine Better Homes and Gardens, Darrell Huff, published more than 60 years ago in 1954 and still in print, translated in many different languages. Some say it is the most widely read statistics book in the world. His many examples of “lies” are the misleading statistical trickery and presentation used in politics, commercial disclosure and the media as ammunition to win support.
Huff was not a trained statistician and his presentation of the topic can be charitably described as informal and some of the illustrations in the book would be quite offensive, if they were included in a contemporary statistic book. But, what was true in 1954 is just as true today.
Huff gives seven common tactics used to knead statistical data into “dough”. Some of them are:
- Analysis of a biased sample that does not represent the intended population leading to distorted findings. Frankly speaking, biased sampling can occur either intentionally or unintentionally. When it is done intentionally, it is obvious that a sample is chosen which ensures results consistent with the desired outcome;
- Outcome from small sample sizes, particularly from non-homogeneous population that yields misleading conclusions because they are not representative of the population;
- When we hear someone says, “The average is …”, we better make sure we know which type of average (Mean? Median? Mode?) that they are talking about. The raw data collected can be so skewed that the three parameters are totally different in values. Also be careful when you read about differences between numbers that come from rankings. They are just nominal figures (in name only), not numerical. It is not correct to make a mean estimation from these figures!
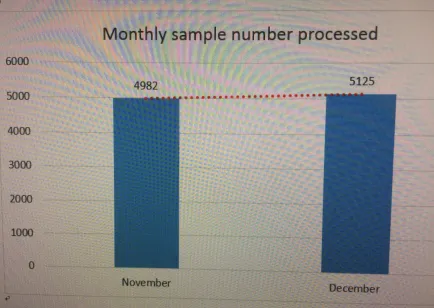
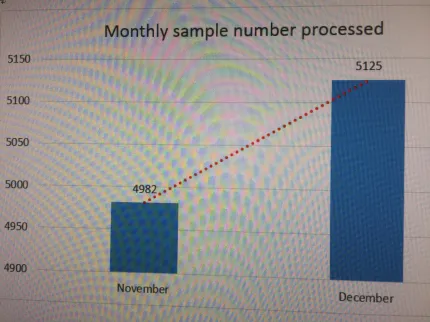
- Visual impressions on graphic presentations can be totally deceptive. One can misuse statistics to make differences seem greater than they actually are by graphically presenting the data in a deceptive manner. Can you tell any difference in Figures 1 and 2 below on the monthly number of samples processed in a testing laboratory?
Figure 1: This graph shows the actual difference between November and December

Figure 2 : This graph exaggerates the difference between November and December

The data shows 4982 samples were processed in November and the number of samples increased to 5125 in the following month. The Figure 1 shows that this 3% improvement was nothing to cry about but when the Figure 2 graph was presented to the management showing the difference between November and December on a different scale, the lab manager might receive a commendation letter from the top management for good performance, as it appears that his laboratory had really made good progress in securing more sample throughputs.
- Incorrectly exerting that there is a direct correlation between two findings in research papers. We often hear this sort of statements in clinical trials on drugs against curing certain diseases but without knowing the reliability of their controlled factor or factors in the experimental trials.
The moral of the story is that we are all consumers of statistics and we are constantly surrounded by information provided by someone who is unethical and is trying to influence us or gain our support. In my opinion, this practice often happens amongst the circles of politics and media although some scientists also get involved either intentionally or unintentionally. By having a basic understanding about the field of statistics, we increase the likelihood that we can ward off those undesirable persons in their attempt to distort the truth and to mislead us.
In short, it is hoped that all of us practice statistics responsibly.
