
This worked example illustrates the use of a certified wheat flour reference material to evaluate analytical bias (recovery) of a Kjeldahl nitrogen method for its crude protein content expressed as K-N.
Those analysts familiar with the Kjeldahl method can testify that it is quite a tedious and lengthy method. It consists of three major steps, starting from strong acid digestion of the test sample with concentrated sulfuric acid and a catalyst to form ammonium sulfate, followed by addition of sodium hydroxide to make it into an alkaline solution, evolving a lot of steam and ammonia during the process, and lastly subject to steam distillation before titrating the excess standard boric solution after reaction with the distilled ammonia gas at the steam distillate collector.
During these processes, there is always a chance to lose some nitrogen content of the sample due to volatility of reactions during the processing, and one can therefore expect to find lower K-N content in the sample than expected. Of course, many modern digestion/distillation systems sold in the market have minimized such losses through apparatus design but some significantly low recoveries do happen, depending on the technical competence and the extent of precautions taken by the laboratory concerned.
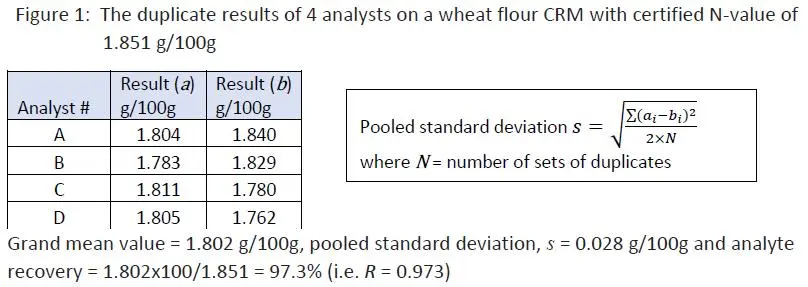
In here, a certified wheat flour reference material with a N- value of 1.851 g/100g + 0.017 g/100g was used. It was subject to duplicate analysis by four analysts in different days, using the same digestion/distillation set of the laboratory. The test data were summarized below and the pooled standard deviation of the exercise was calculated together with its overall mean value:

Although 97.3% recovery of the K-N content in the certified reference material looks reasonably close to 100%, we still have to ask if the grand mean value of 1.802 g/100g was significantly different from the certified value of 1.851 g/100g. If it were significantly different, we could conclude that the average test result in this exercise was bias.
A significance (hypothesis) testing using Student’s t-test statistic was carried out as described below:
Let Ho : Grand observed mean value = certified value (1.851 g/100g)
H1 : Grand observed mean value ≠ certified value

By calculation, t-value was found to be 3.532 whilst t -critical value obtained by MS Excel® function “=T.INV.2T(0.05,3)” was 3.182. Since 3.532 > 3.182, the Null Hypothesis Ho was rejected, indicating the difference between the observed mean value and the certified value was significant. We can also use Excel function “=T.DIST.2T(3.532,3)” to calculate the probability p-value, giving p = 0.039 which was less than 0.05. Values below 0.05 indicate significance (at the 95% level).
Now, you have to exercise your professional judgement if you would wish to make a correction to your routine wheat flour sample analyses posted within the validity of your CRM checks by multiplying test results of actual samples by a correction factor of 1/0.973 or 1.027.
The method traditionally practiced by most test laboratories in the estimation of measurement uncertainty is by the ISO GUM (ISO/IEC Guide 98-3) approach, which is quite tedious and time consuming to study and gather uncertainty contributions from each and every step of the test method. An alternative way of looking at uncertainty is to attempt to study the overall performance of the analytical procedure by involving replication of the whole procedure to give a direct estimate of the uncertainty for the final test result. This is the so-called ‘top-down’ approach.
We may use the data from inter-laboratory study, in-house validation or ongoing quality control. This approach is particularly appropriate where individual effects are poorly understood in terms of their quantitative theoretical models which are capable of predicting the behavior of analytical results for particular sample types. By this approach, it is suffice to consider reproducibility from inter-laboratory data or long-term within-laboratory precision as recommended by ISO 21748, ISO 11352 and ASTM D 6299.
However, one must be aware of that by repeatedly analyzing a given sample over several times will not be a good estimate of the uncertainty unless the following conditions are fulfilled:
The conclusion is that replicated data by a single analyst on same equipment over a short period of time are not sufficient for uncertainty estimation. If the top-down approach is to be followed, we must obtain a good estimate of the long-term precision of the analytical method. This can be done for example, by studying the precision for a typical test method used as a QC material over a reasonable period of time. We may also use a published reproducibility standard deviation for the method in use, provided we document proof that we are able to follow the procedure closely and competently.
When we repeat analysis of a sample several times, we get a spread of results surrounding its average value. This phenomenon gives rise to data precision, but provides no clue as to how close the results are to the true concentration of the analyte in the sample.
However, it is possible for a test method to produce precise results which are in very close agreement with one another but are consistently lower or higher than they should be. How do we know that? Well, this observation can be made when we carry out replicate analysis of a sample with a certified analyte value. In this situation, we know we have encountered a systematic error in the analysis.
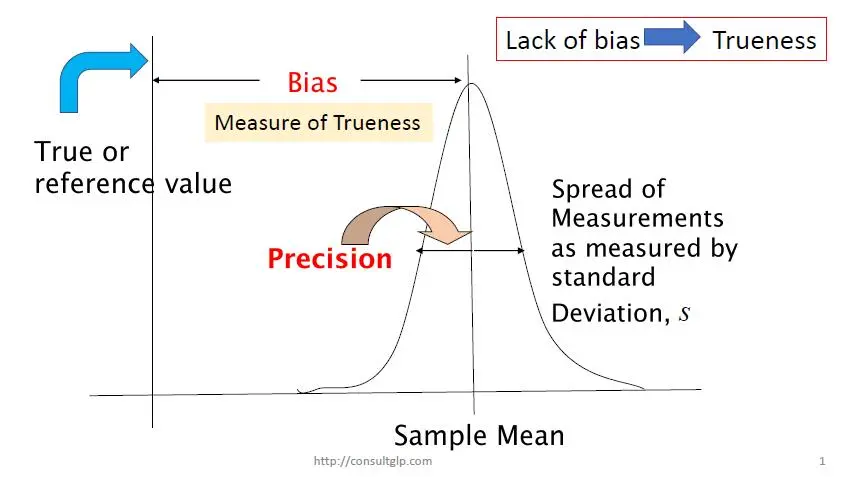
The term “trueness” is generally referred to the closeness of agreement between the expectation of a test result or a measurement result and a true value or an accepted reference value. And, trueness is normally expressed in terms of bias. Hence, bias can be evaluated by comparing the mean of measurement results and an accepted reference value, as shown in the figure below.

Therefore, bias can be evaluated by carrying out repeat analysis of a suitable material containing a known amount of the analyte (i.e. reference value) mu, and is calculated as the difference between the average of the test results and the reference value:

We often express bias in a relative form, such as a percentage:
or as a ratio when we assess ‘recovery’ in an experiment:
In metrology, error is defined as “the result of measurement minus a given true value of the measurand”.
What is ‘true value’?
ISO 3534-2:2006 (3.2.5) states that “Value which characterizes a quantity or quantitative characteristic perfectly defined in the conditions which exist when that quantity or quantitative characteristic is considered.”, and the Note 1 that follows suggests that this true value is a theoretical concept and generally cannot be known exactly.
In other words, when you are asked to analyze a certain analyte concentration in a given sample, the analyte present has a value in the sample, but what we do in the experiment is only trying to determine that particular value. No matter how accurate is your method and how many repeats you have done on the sample to get an average value, we would never be 100% sure at the end that this average value is exactly the true value in the sample. We bound to have a measurement error!
Actually in our routine analytical works, we do encounter three types of error, known as gross, random and systematic errors.
Gross errors leading to serious outcome with unacceptable measurement is committed through making serious mistakes in the analysis process, such as using a reagent titrant with wrong concentration for titration. It is so serious that there is no alternative but abandoning the experiment and making a completely fresh start.
Such blunders however, are easily recognized if there is a robust QA/QC program in place, as the laboratory quality check samples with known or reference value (i.e. true value) will produce erratic results.
Secondly, when the analysis of a test method is repeated a large number of times, we get a set of variable data, spreading around the average value of these results. It is interesting to see that the frequency of occurrence of data further away from the average value is getting fewer. This is the characteristic of a random error.
There are many factors that can contribute to random error: the ability of the analyst to exactly reproduce the testing conditions, fluctuations in the environment (temperature, pressure, humidity, etc.), rounding of arithmetic calculations, electronic signals of the instrument detector, and so on. The variation of these repeated results is referred to the precision of the method.
Systematic error, on the other hand, is a permanent deviation from the true result, no matter how many repeats of analysis would not improve the situation. It is also known as bias.
A color deficiency technician might persistently overestimate the end point in a titration, the extraction of an analyte from a sample may only be 90% efficient, or the on-line derivatization step before analysis by gas chromatography may not be complete. In each of these cases, if the results were not corrected for the problems, they would always be wrong, and always wrong by about the same amount for a particular experiment.
How do we know that we have a systematic error in our measurement?
It can be easily estimated by measuring a reference material a large number of times. The difference between the average of the measurements and the certified value of the reference material is the systematic error. It is important to know the sources of systematic error in an experiment and try to minimize and/or correct for them as much as possible.
If you have tried your very best and the final average result is still significantly different from the reference or true value, you have to correct the reported result by multiplying it with a certain correction factor. If R is the recovery factor which is calculated by dividing your average test result by the reference or true value, the correction factor is 1/R.
Today, there is another statistical term in use. It is ‘trueness’.
The measure of truenessis usually expressed in terms of bias.
Trueness in ISO 3534-2:2006 is defined as “The closeness of agreement between the expectation of a test result or a measurement result and a true value.” whilst ISO 15195:2018 defines trueness as “Closeness of agreement between the average value obtained from a large series of results of measurements and a true value.”. The definition of ISO 15195 is quite similar to those of ISO 15971:2008 and ISO 19003:2006. The ISO 3534-2 definition includes a note that in practice, an “accepted reference value” can be substituted for the true value.
Is there a difference between ‘accuracy’ and ‘trueness’?
The difference between ‘accuracy’ and ‘trueness’ is shown in their respective ISO definition.
ISO 3534-2:2006 (3.3.1) defines ‘accuracy’ as “closeness of agreement between a test result or measurement result and true value”, whilst the same standard in (3.2.5) defines ‘trueness’ as “closeness of agreement between the expectation of a test result or measurement result and true value”. What does the word ‘expectation’ mean here? It actually refers to the average of the test result, as given in the definition of ISO 15195:2018.
Hence, accuracy is a qualitative parameter whilst trueness can be quantitatively estimated through repeated analysis of a sample with certified or reference value.
References:
ISO 3534-2:2006 “Statistics – Vocabulary and symbols – Part 2: Applied statistics”
ISO 15195:2018 “Laboratory medicine – Requirements for the competence of calibration laboratories using reference measurement procedures”
In the next blog, we shall discuss how the uncertainty of bias is evaluated. It is an uncertainty component which cannot be overlooked in our measurement uncertainty evaluation, if present.